Institute of Bioinformatics Münster
BUSCO
Validation of Genome Annotation with BUSCO
Description
Benchmarking Universal Single-Copy Orthologs (BUSCO)
is a tool used for measuring the completeness of genome assembly data, annotated gene sets, or transcriptomes in terms of expected gene contend. It compares the data to core sets of orthologous groups with genes present as single-copy ortholog in at leats 90% of the species within the linage of the database (www.orthodb.org). So, it would be expected that every one of this single-copy orthologous genes occurs in genome annotations from a species of this linage because these genes represent conserved genes. As you can see in Figure 1, Busco is acting on different genome, transcriptome, or proteom data levels. Depending on the input data, BUSCO works with different programs to compare the selected group of data in the single ortholgs database from OrthoDB. The Pipeline uses HMMER3
for generating hidden markov model (HMM) profiles on amino acid alignments. Subsequently it compares the input data with the database groups and specify the occurnce of a single-copy orthologs by an cut-off as complete or fragmented. For transcriptomes, BUSCO searches the longest open reading frame by running HMMER. For genomes, BUSCO has to first annotate genes with Augustus, which uses amino acid BUSCO group block-profiles. This is performed on genomic loci detected by tBLASTn using BUSCO group consensus sequences. As the last step, the results of BUSCO are defined as ‘Complete’ (C), genes which were found once in the single-copy ortholog database, or as ‘duplicated’ (D),single-copy ortholog genes which were found more than once. These duplicated genes rarely occur since the genes are evolving under a single-copy control (Waterhouse et al., 2011), so a recovery of many duplicates may therefore indicate an erroneous assembly of haplotypes.‘Fragmented’ (F) means that genes are matching just partially to a single-copy ortholog DB and genes which are expected but were not detected are called ‘missing’ (M).
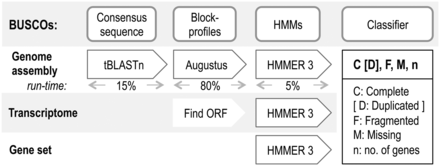
- Figure 1: BUSCO assessment workflow with relative runtime [Source: https://academic.oup.com/bioinformatics/article/31/19/3210/211866].
Results
Genome Data
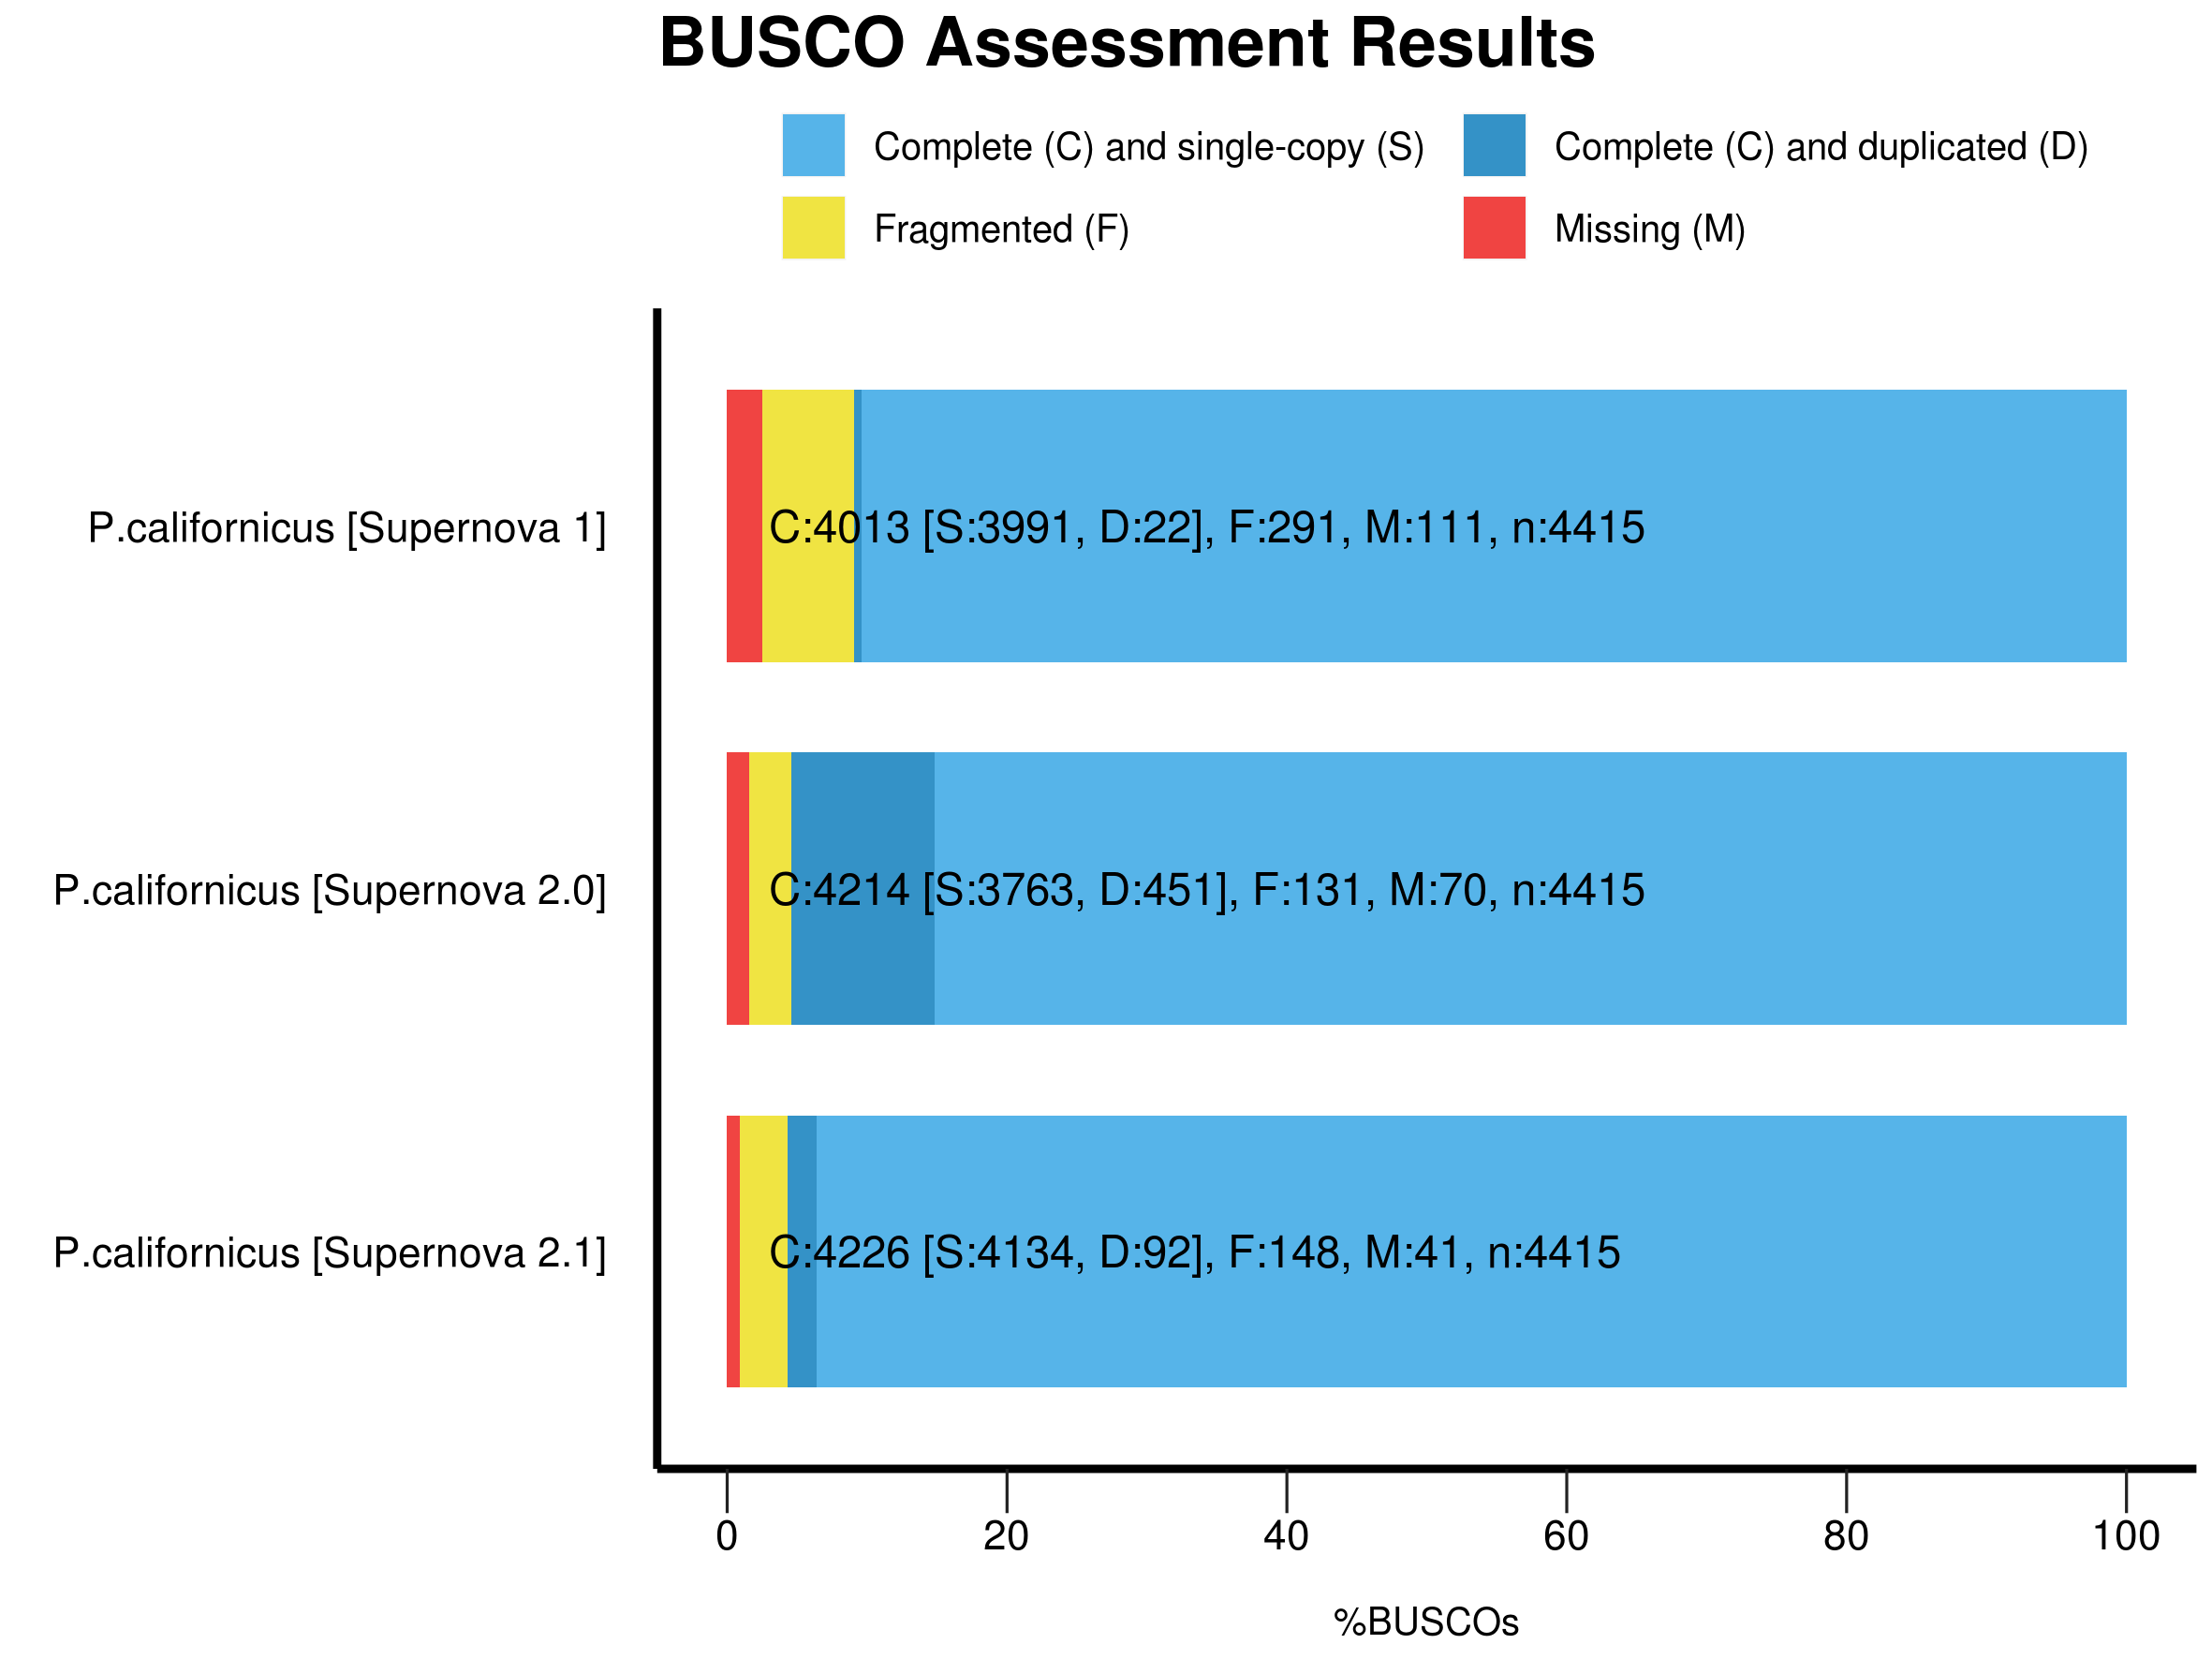
- Figure 2: BUSCO analysis for the completeness of the P. californicus genome assembly produced by different versions of the Supernova assembler.
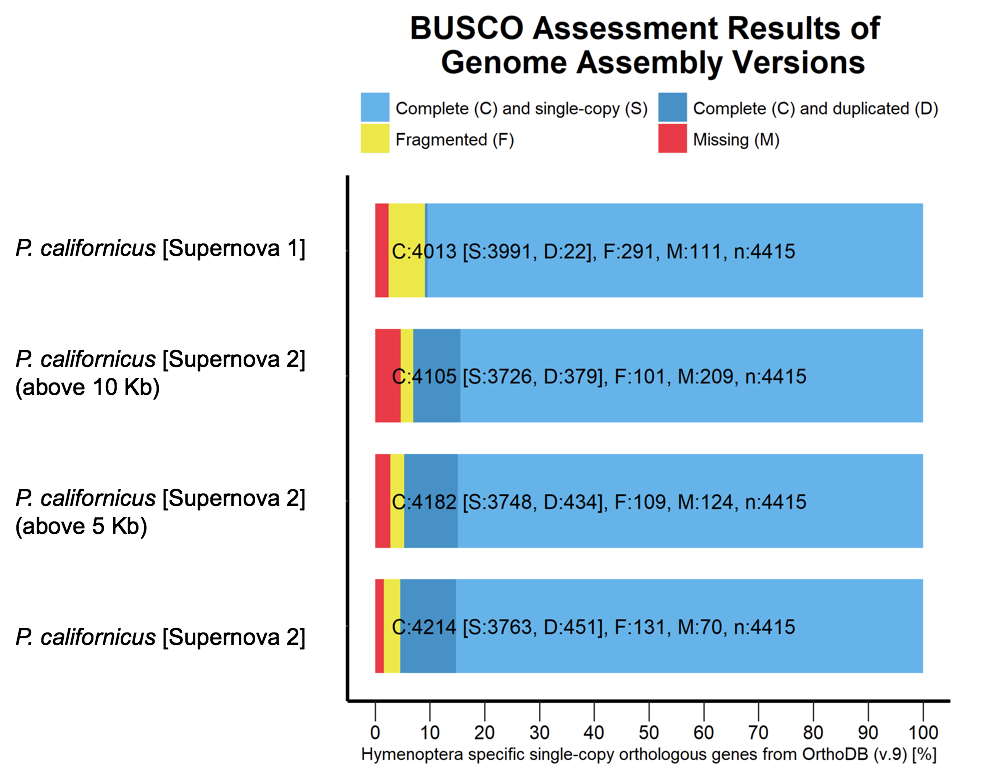
- Figure 3: BUSCO analysis for comparing the P. californicus genome assemblies while using the OrthoDB (v. 9) database for Hymenoptera.
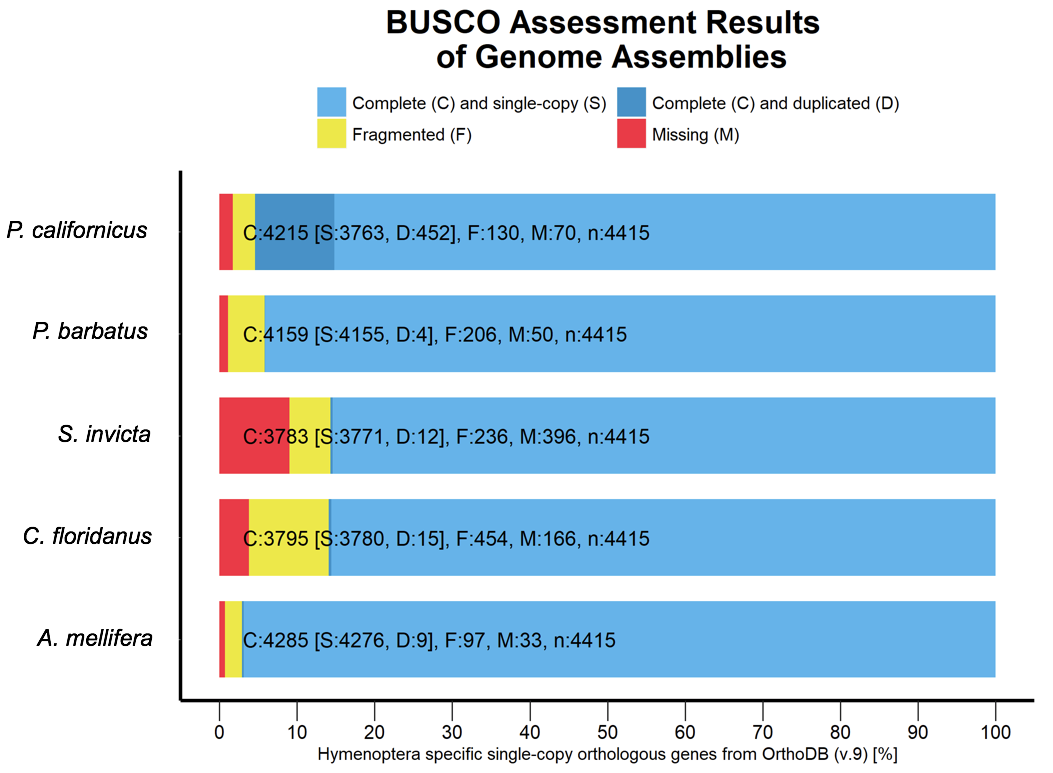
- Figure 4: BUSCO analysis for the completeness of the P. californicus, A. melliferra, P. barbatus, S. invicta and C. floridansis genome assembly while using the OrthoDB (v. 9) database for Hymenoptera.
Transcript Data
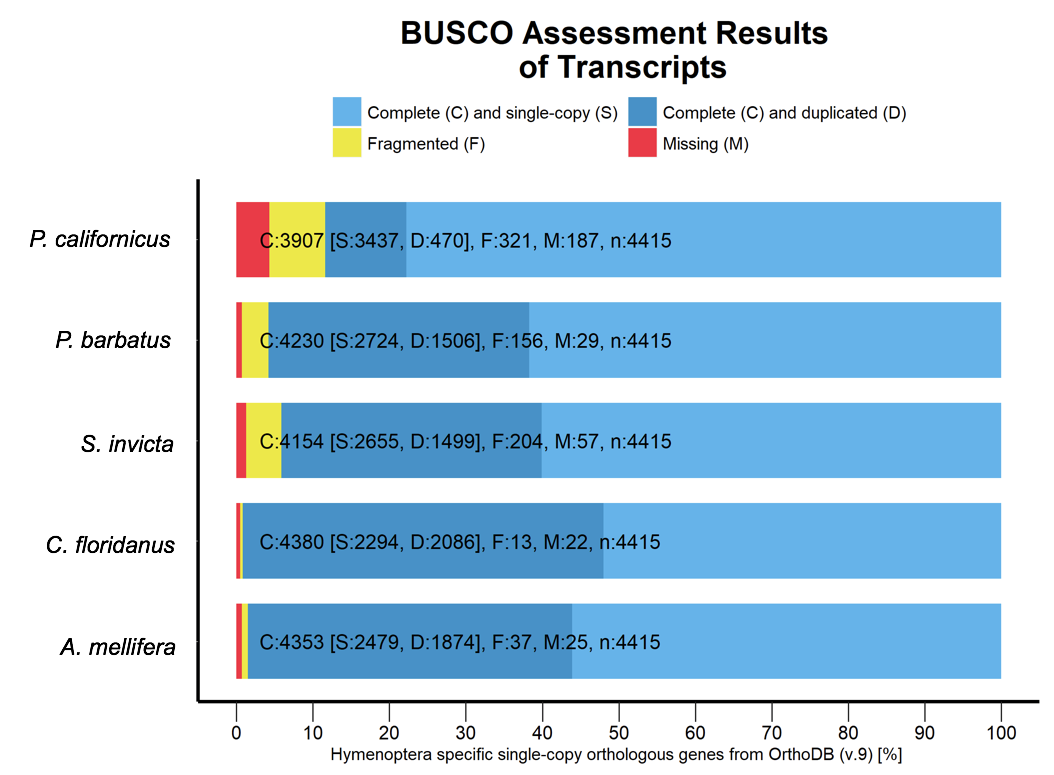
- Figure 5: BUSCO analysis for the completeness of the P. californicus, A. melliferra, P. barbatus, S. invicta and C. floridansis transcript assembly while using the busco database for hymenoptera.
Protein Data
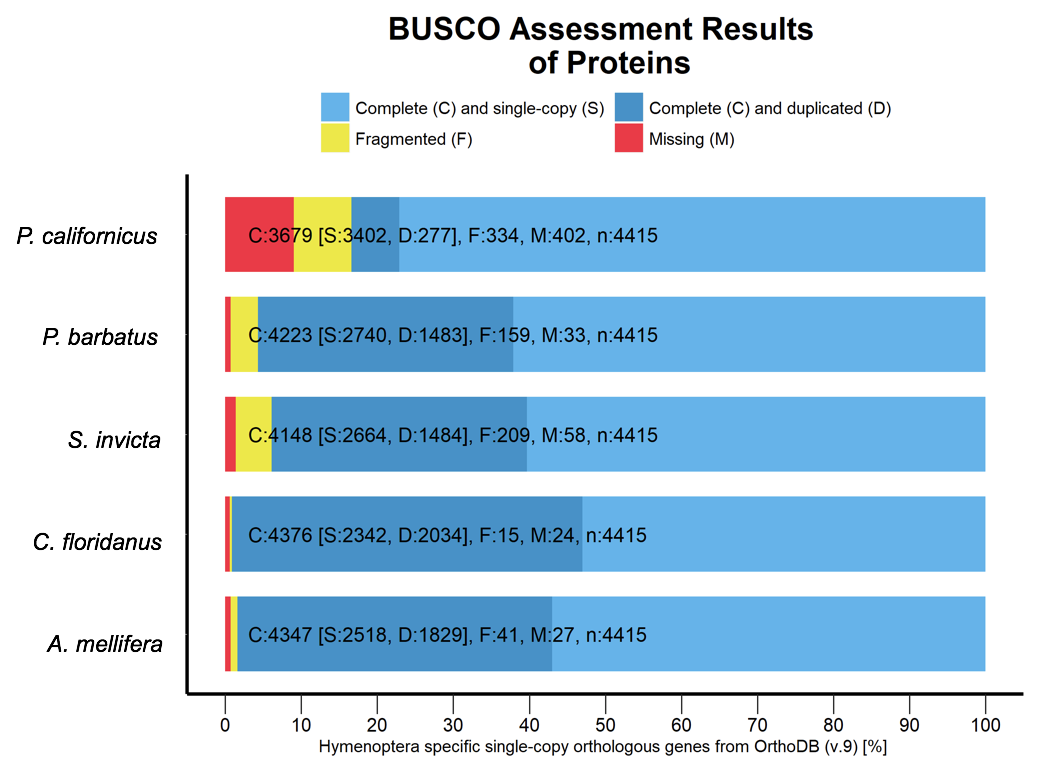
- Figure 6: BUSCO analysis for the completeness of the P. californicus, A. melliferra, P. barbatus, S. invicta and C. floridansis proteins while using the busco database for hymenoptera.
References
- Robert M. Waterhouse, Evgeny M. Zdobnov, and Evgenia V. Kriventseva; Correlating Traits of Gene Retention, Sequence Divergence, Duplicability and Essentiality in Vertebrates, Arthropods, and Fungi, Genome Biology and Evolution, 3, 75–86, 1 Jan 2011 https://doi.org/10.1093/gbe/evq083
2020-11-18 22:32