The command line application produces "png"-graphs.
Usage
After downloading the application can be started by entering
java -jar sbgcmd.jar -input files [-order o] [-info n,n,...] [-width n] [-min n -max n] [-ql n]in a terminal.
-
input: Specifies an input file(s). Using the wildcard
"*" gives you the option to specify several files like with
"/path/to/the/files/*.fa", that means add double-quotes if using
a wildcard! This parameter is neccesary to be set!
- order: The order of the lines in the graph. The values are START, LENGTH and END (Default START).
- info: A list of numbers -separated by commas- specifying the columns which are written on the bars for every input sequence. (Default to whole line of the input data). A column number starts with 0.
- width: The width of the generated graphs in pixels (Default 1024).
- min, max: The x-value range of the graphs. Default is that min and max are set automatically to the start and end values found in the input data. Note: Both paramters have to be specified or none of them!
- ql: The index of the query length column (starting with 0!). If providing this value the resulting graphs will display the bars starting from position 1 to the maximum value found at that position.
Input and Output
This application takes a set of blast output of the following format
| Column | Name |
|---|---|
| 0 | query name |
| 1 | subject name |
| 2 | percent identities |
| 3 | aligned length |
| 4 | number of mismatched positions |
| 5 | number of gap positions |
| 6 | query sequence start |
| 7 | query sequence end |
| 8 | subject sequence start |
| 9 | subject sequence end |
| 10 | e-value |
| 11 | bit score |
Example
SAM50_AMEBA     SAM50_AMEBA     100.00  118     0       0       1       118     1       118     9e-67    243
SAM50_AMEBA     gi|126338997|ref|XP_001362470.1|        29.66   118     70      4       3       115     151     260     4e-09   52.4
SAM50_AMEBA     gi|114686851|ref|XP_001172164.1|        28.81   118     71      4       3       115     72      181     1e-08   50.8
Despite the graphical version the command line version generates graph files in the following way: for every different query name all entries are put together and written in a separate "png" file in the same directory as the input file(s). The output filenames are generated using following rule
inputfilename + "_" + query_name + ".png"The start and end positions are used for ordering.
Note: the output filenames will contain only valid letters, so they will not have any german or other special language character or "|", ":" inside! This avoids problems with filenaming on different operating systems!
Example
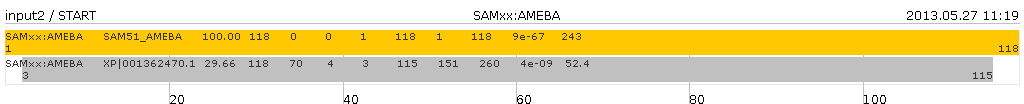
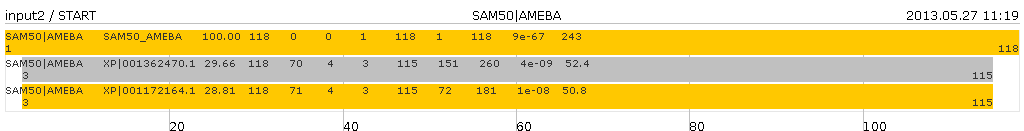
Assume input file called "input2" with following content
SAM50|AMEBA     SAM50_AMEBA     100.00  118     0       0       1       118     1       118     9e-67    243
SAM50|AMEBA     XP|001362470.1  29.66   118     70      4       3       115     151     260     4e-09   52.4
SAM50|AMEBA     XP|001172164.1  28.81   118     71      4       3       115     72      181     1e-08   50.8
SAMxx:AMEBA     SAM51_AMEBA     100.00  118     0       0       1       118     1       118     9e-67    243
SAMxx:AMEBA     XP|001362470.1  29.66   118     70      4       3       115     151     260     4e-09   52.4
The output files(s) have (start with) the same name as the input file(s) and will be written in the same directory. For every different query name the will be an output file. In this case two files: "input2-SAM50_AMEBA.png" and "input2-SAMxx_AMEBA.png".
The command
java -jar sbgcmd.jar -input input2produces following graphs
 and
and