Usage
After downloading you can start the application by entering
java -jar /path/to/distg.jarin a terminal.
Overview
This program counts the length of fasta sequences and make a graphical representation. There are two different graphs. The first is the distribution graph, giving an overview of all length of read fasta files (sequences) so far. The second graph displays a specific file's counting as a set of rectangles.
Saving Data
There are two options when you want to save the numbers from the distribution. The first is "Save All Data" which will produce a text file with every number between 0 and the maximum value chosen at the start of the program, along with how many times each number appeared in each file. The second option is "Save Displayed Data" which will produce a text file with only the numbers between the minimum value and the maximum value chosen in the graph parameters.
Distribution graph
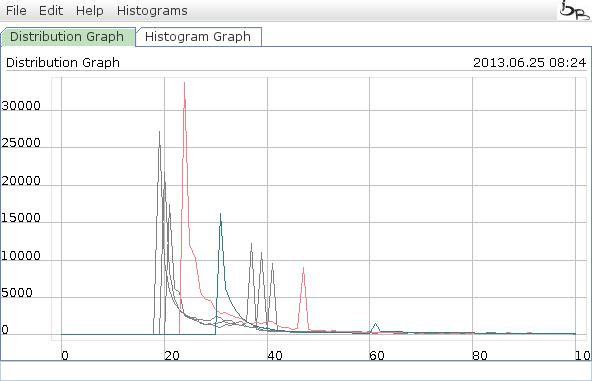
This graphs displays the distribution of the values from several files. You have the following actions inside this graph:
- Zoom: Just scroll the whell up or down.
- Move: Click in the graph and move the (clicked) mouse to the desired position.
- Select area: Press the CTRL key and click the mouse to select one corner, keep the CTRL key pressed and move the mouse to the desired opposite corner of the selected rectangle. After releasing the mouse the selected rectangle will be the new displayed region.
- Change Color: By clicking on a graphical element a color selection dialog will be displayed.
- Reset: By clicking the "R" key the graph will be reset, so the graph will be fully displayed in the default "resolution", that means the axes are recalculated to fit the entire graph inside.
Histogram graph
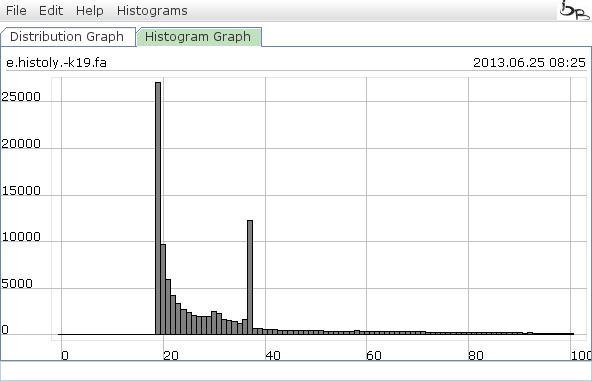
This graphs displays the distribution of one input file.
- Zoom: Just scroll the whell up or down.
- Move: Click in the graph and move the (clicked) mouse to the desired position.
- Select area: Press the CTRL key and click the mouse to select one corner, keep the CTRL key pressed and move the mouse to the desired opposite corner of the selected rectangle. After releasing the mouse the selected rectangle will be the new displayed region.
- Select a bar: By clicking with the right button into an elements, it will be selected and colored red. Additionally the range of selection will be displayed on the top.
- Reset: By clicking the "R" key the graph will be reset, so the graph will be fully displayed in the default "resolution", that means the axes are recalculated to fit the graph with respect to the min..max values in the params dialog.