It is recommended to use any other browser but Firefox for opening this webpage.
Summary
| Genome Assembly | |
|---|---|
| Assembly size | 241 Mbp |
| Number of contigs | 6,793 |
| N50 | 208,871 bp |
| N90 | 16,229 bp |
| GC-contend | 36.3 % |
| Repeat Annotation | |
| Occupied by repeats | 48.8 Mbp (20.25 %) |
| Number of repeats | 326,883 |
| Genome Annotation | |
| Number of predicted protein coding genes | 15,688 |
| Number of classified unique protein coding genes (a) | 13,983 |
| Number of unclassified unique protein coding genes (a) | 1,535 |
| Number of non-coding RNAs | 1,395 |
The Project
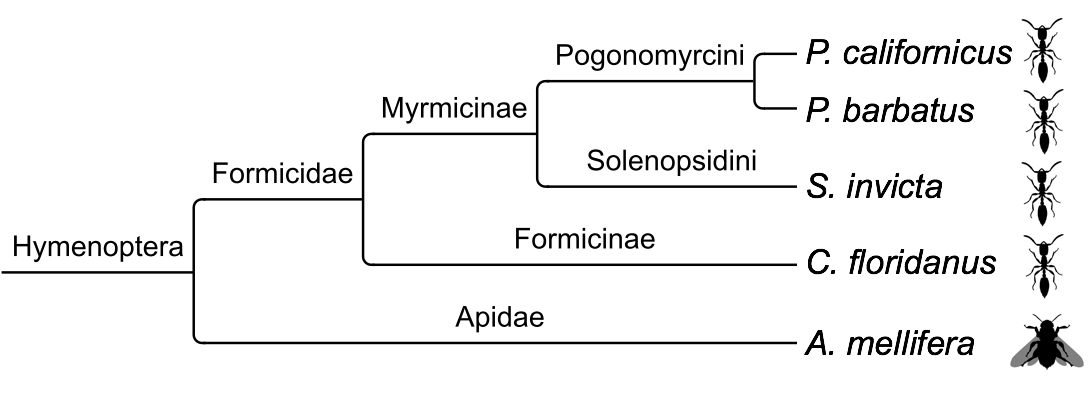
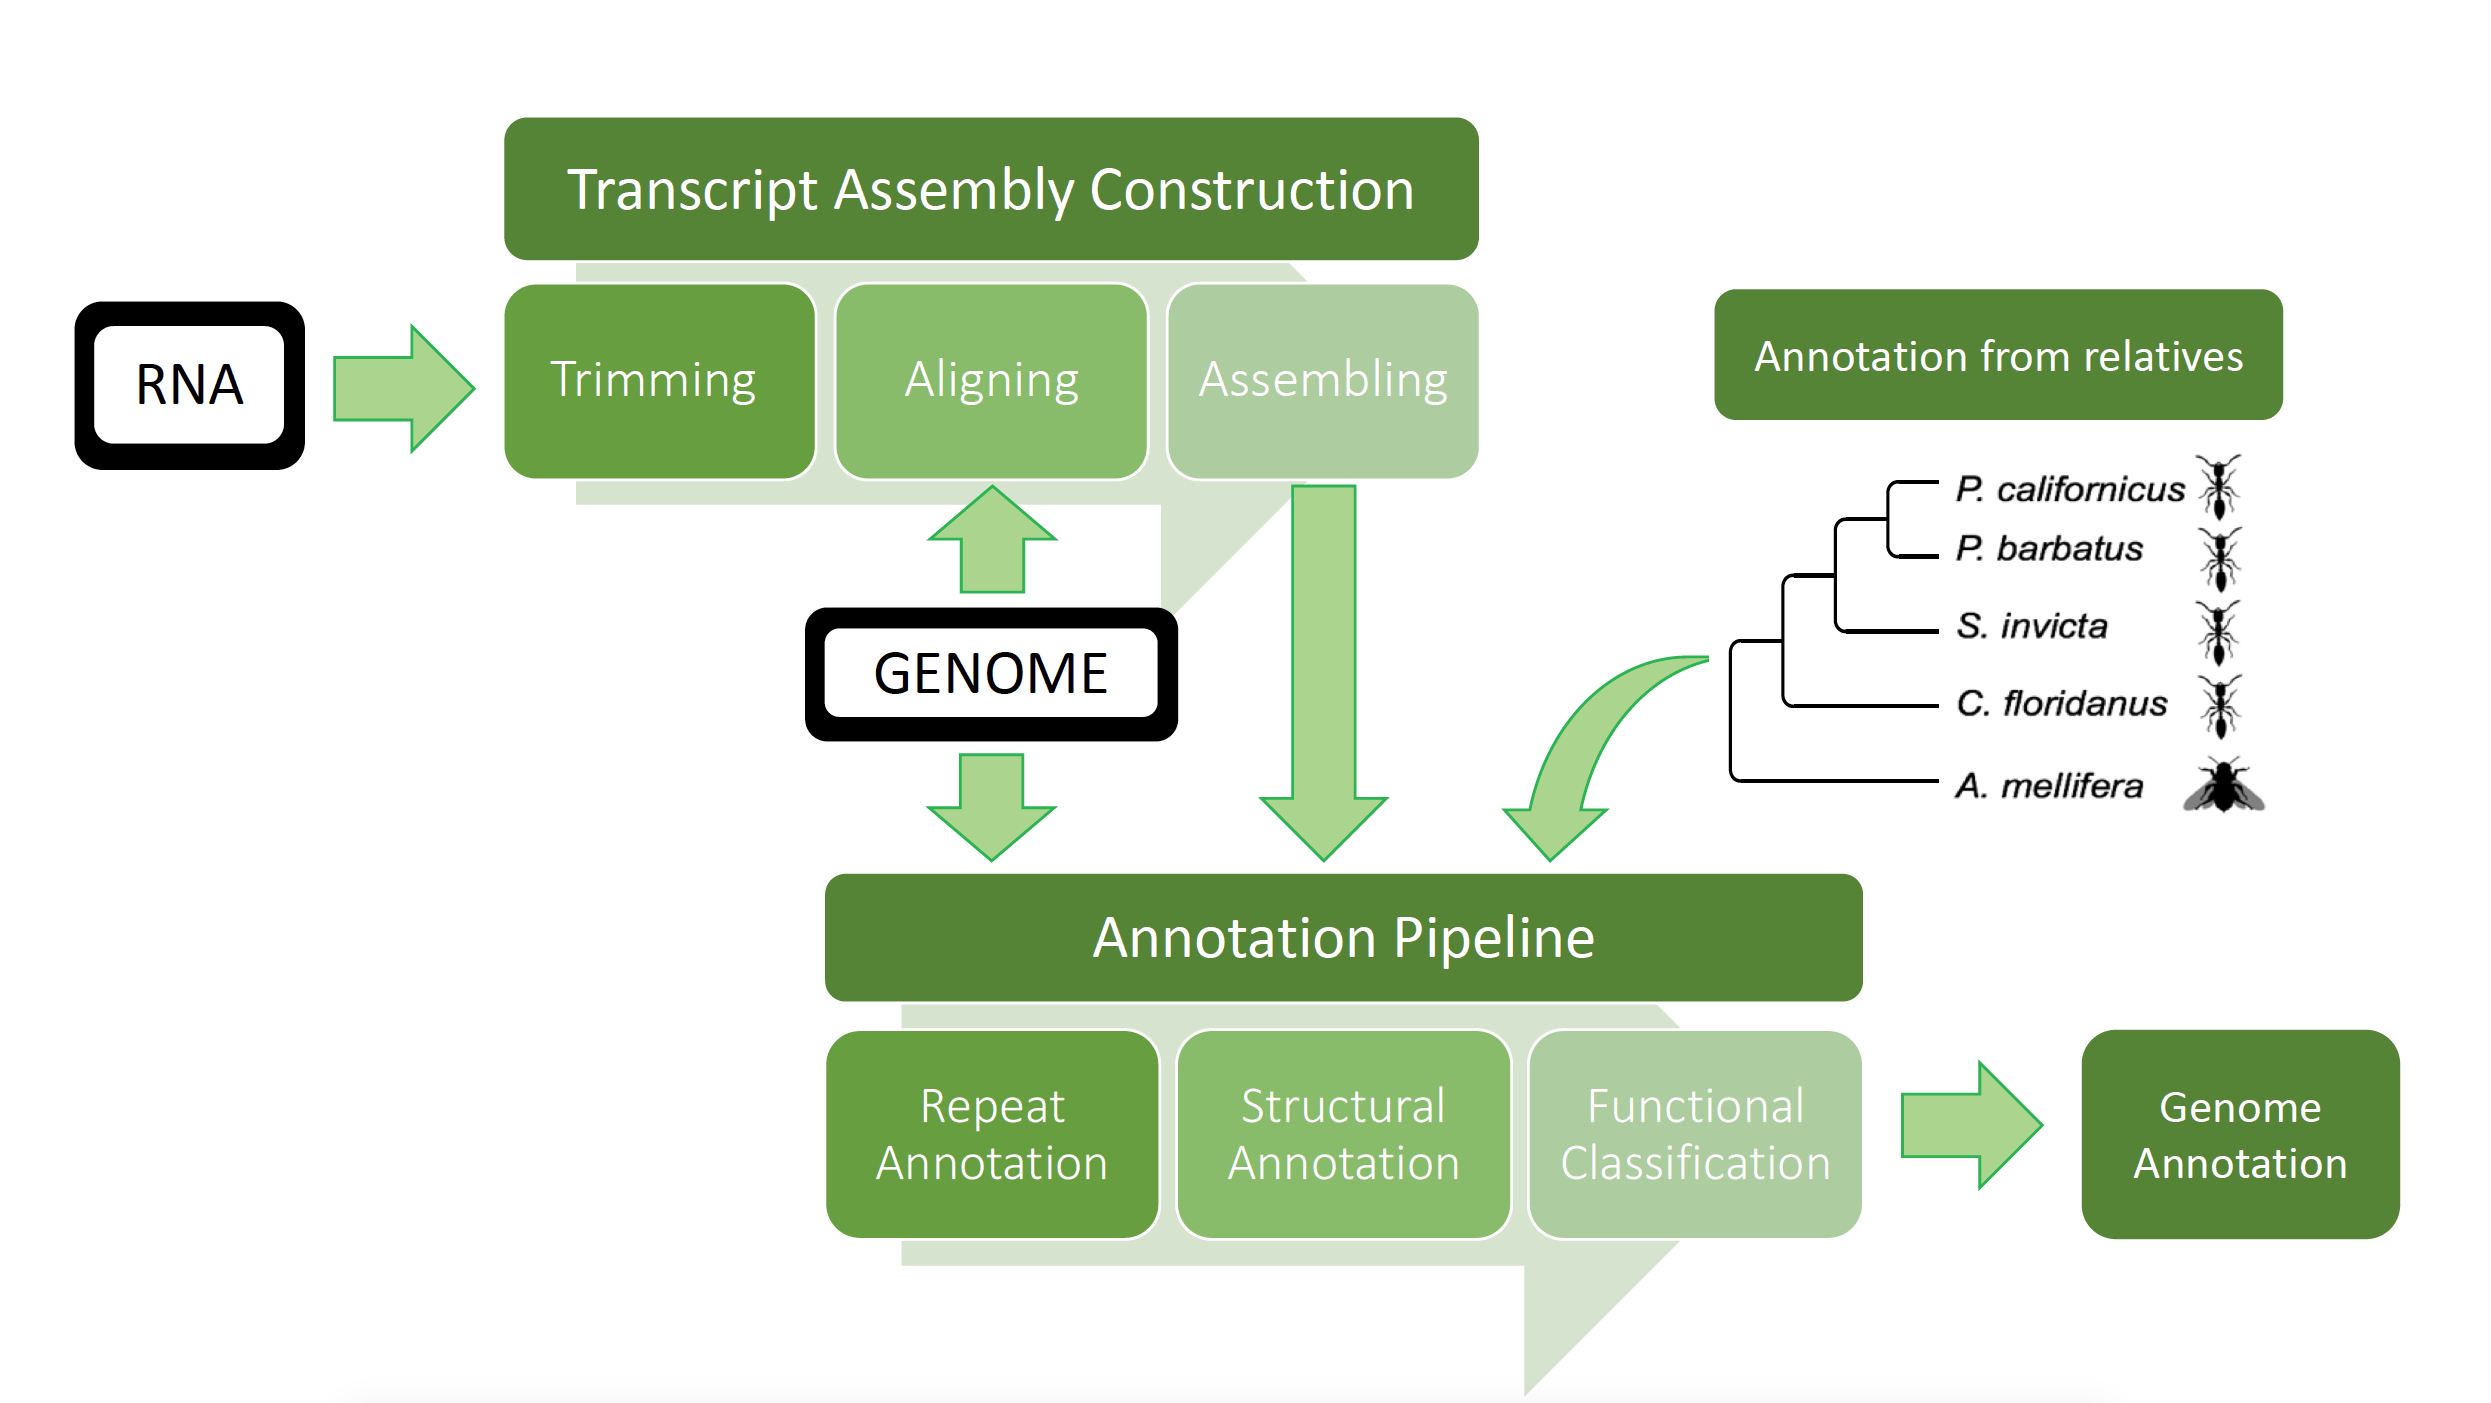
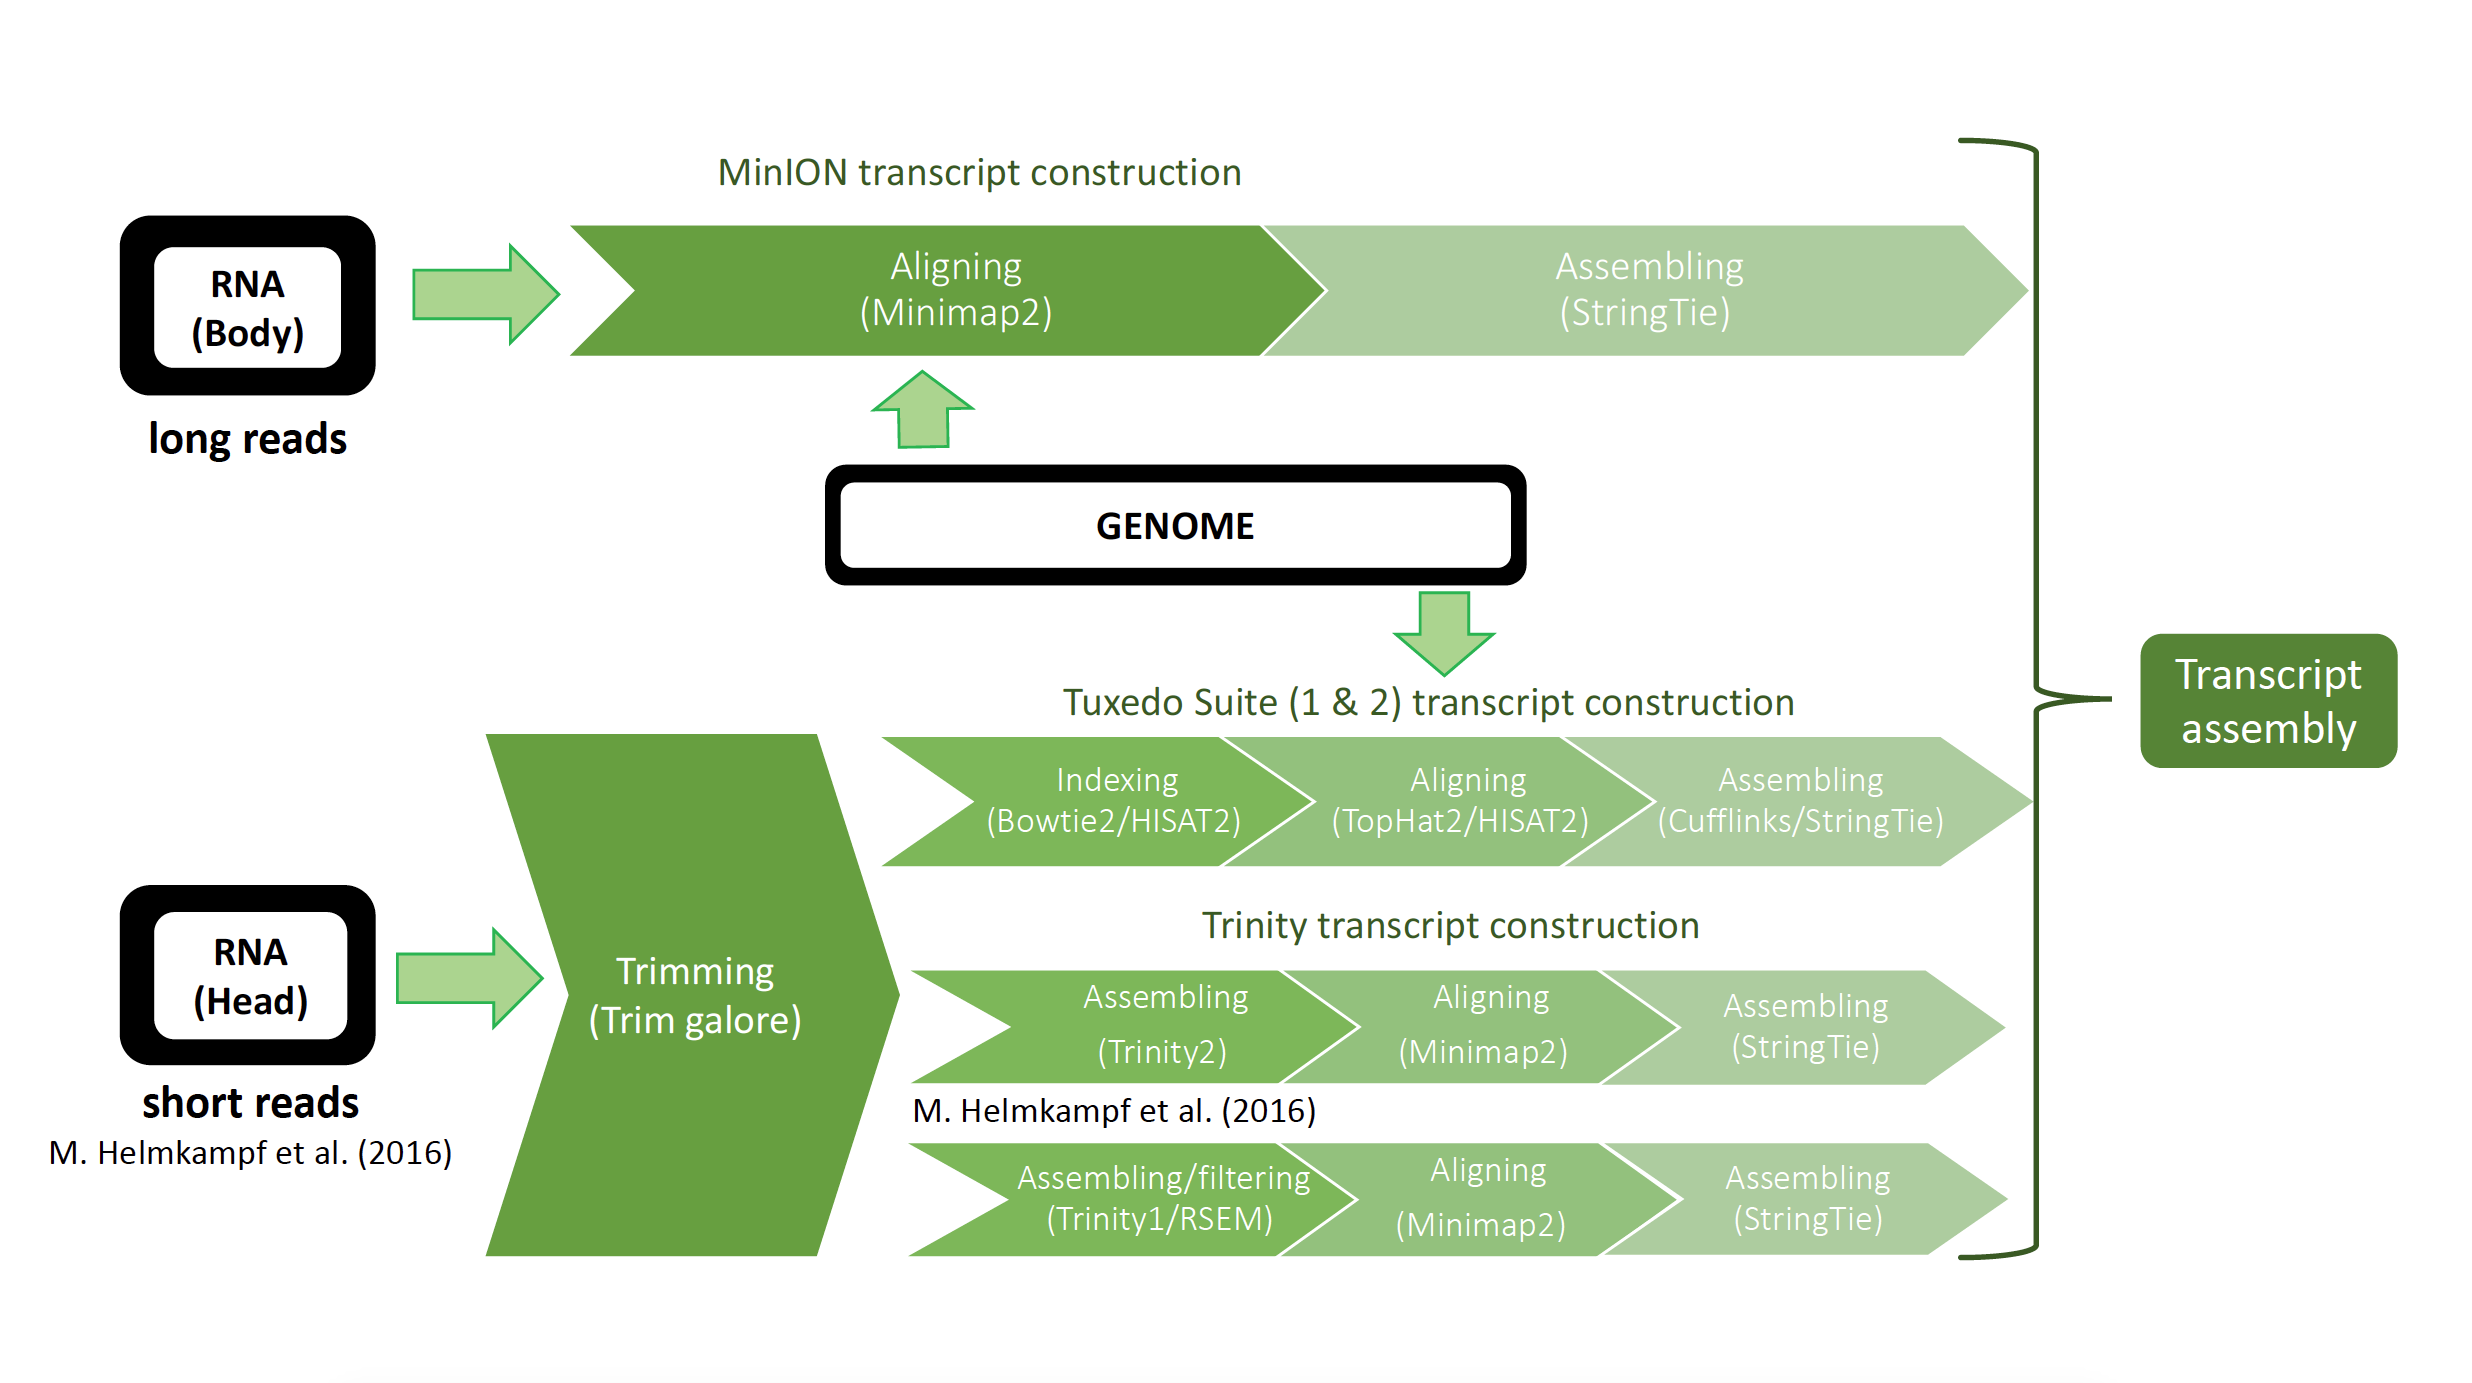
This website provides necessary information about the Pogonomyrmex californicus de-novo genome sequencing and annotation project. Genome annotation of this ant was performed by using data from relative insects of P. californicus (see Figure 1) and RNA sequencing data provided by M. Helmkampf et al. (2016). This project includes some steps which are displayed in Figure 2 and Figure 3.

- Figure 1: Cladogram of relative insect species. Data from these genomes were used as reference annotations for the genome annotation pipeline of P. californicus.
The Pipeline
The entire project work flow is displayed in Figure 2. The transcriptome construction is displayed in detail in Figure 3. The main steps of the transcript construction consist of mainly trimming the raw RNA Illumina seq reads, aligning the reads to the genome, and finally construction of an assembly out of the aligned reads. This out coming transcriptome was added to the genome annotation (GeneModelMapper (GeMoMa) and MAKER 2). But before the genome annotation started, the repeats in the genome were masked and annotated using RepeatMasker. GeMoMa is the first pipeline in the whole genome annotation process. Data from already annotated relative species were used to generate a gene model for annotating the target genome. Four annotated relative insect genomes were used as reference genomes and mapped to the P. californicus genome assembly. The transcript data from the transcript annotation was added to the annotation. The out coming GeMoMa prediction was handed to MAKER in order to include additional information. MAKER generates more accurate predictions which are dependent from relative species and is able to predict P. californicus specific genes. Figure 2: Overview of the whole process which generated the genome annotation of P. californicus is displayed here. The genome is displayed as a black box with unknown content in the beginning of the pipeline. The RNA seq data from P. californicus is also displayed as a black box with unknown content. This represents a summary of different sequencing approaches. Two workflows are displayed in this graph, the upper one represents the transcript assembly and the lower one presents the pipeline for the genome annotation. The data from the transcript assembly construction (see Figure 3 for details) was handed to the genome annotation programs GeMoMa and MAKER in order to use the assembled transcripts for the detection of proteins in the P. californicus genome. The entire project work flow is displayed in Figure 2. The transcriptome construction is displayed in detail in Figure 3. The main steps of the transcript construction is mainly trimming of the raw RNA Illumina seq reads, aligning the reads to the genome, and finally construction of an assembly out of the aligned reads. This outcoming transcriptome were added to the genome annotation (GeneModelMapper (GeMoMa) and MAKER 2). But before the genome annotation starts, the repeats in the genome were masked and annotateed while using RepeatMasker. GeMoMa is the first pipeline in the whole genome annotation process. Data from already annotated relative species were used to generate a gene model for annotating the target genome. Four annotated relative insect genomes were used as reference genomes and mapped to the P. californicus genome assembly. The transcript data from the transcript annotation has been added to the annotation. The outcoming GeMoMa prediction was handed to MAKER in order to included additionally informations. MAKER generates more accurate predictions which are idependet from relative species and is able to predict P. californicus specifc genes.

- Figure 2: Overview of the whole process which generated the genome annotation of P. californicus is displayed here. The genome is displayed as a black box with unknown content in the beginning of the pipeline. The RNA seq data from P. californicus is also displayed as a black box with unknown content. This represents a summary of different sequencing approaches. Two workflows are displayed in this graph, the upper one represents the transcript assembly and the lower one presents the pipeline for the genome annotation. The data from the transcript assembly construction (see Figure 3 for details) was handed to the genome annotation programs GeMoMa and MAKER in order to use the assembled transcripts for the detection of proteins in the P. californicus genome.

- Figure 3: Overview of the process which was generated to create a final Transcriptome from different data sources and with different pipelines. There are two RNA data sources, one from the whole body of P. californicus sequenced by a long read sequencer (MinION) and the second one from the head of the ant sequenced by short read sequencer (Illumina) coming from M. Helmkampf et al. (2016).